

Solar Analytics • Renewable Intelligence • BI Systems
Solar Plant Dashboard: Real-Time Monitoring & Performance Intelligence
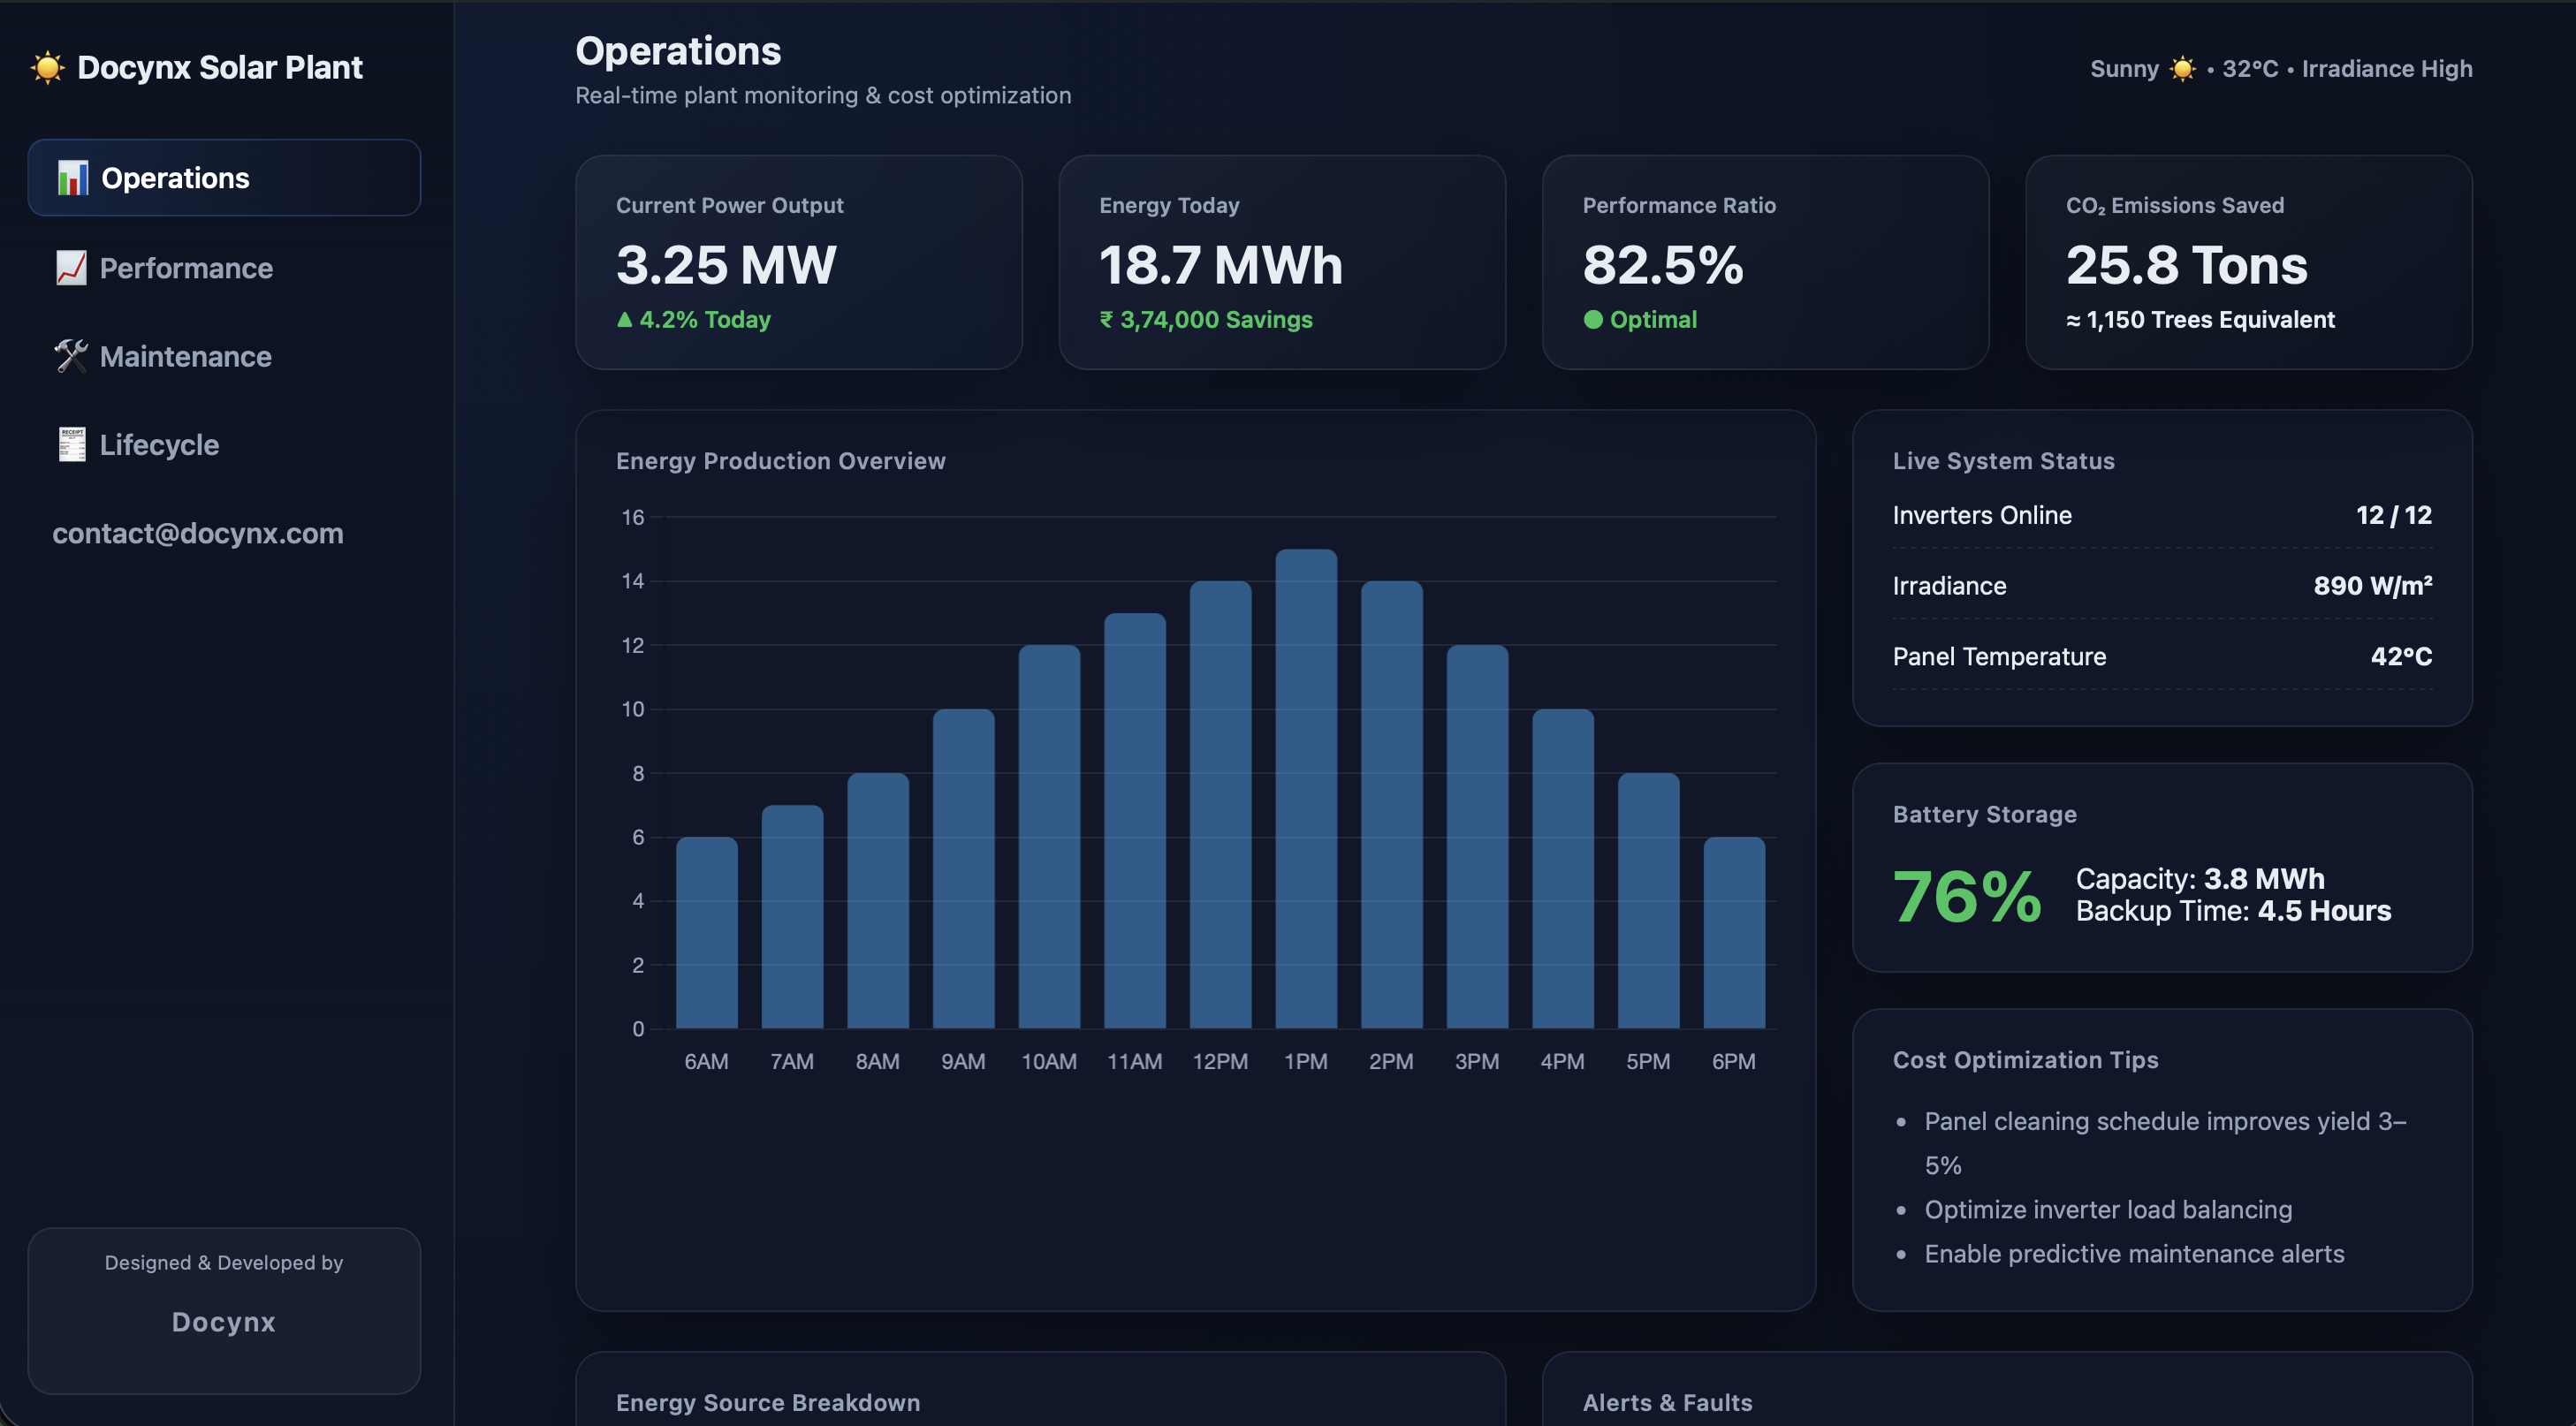
Transform live solar plant data into actionable insights with interactive analytics, predictive intelligence, and visual performance monitoring.
Live Generation
124.6 MW
▲ +2.4% vs yesterday
Performance Ratio
92.8%
▲ Optimal range
Active Alerts
3
Requires attention
CO₂ Offset Today
1,284 t
Environmental impact
Explore Interactive Dashboard
See real-time generation, performance KPIs, and intelligent analytics in action.
Open Live Dashboard →What is a Solar Plant Dashboard?
A centralized analytics interface that visualizes generation metrics, equipment status, storage intelligence, and financial performance in real time.
Core Capabilities
Live Power Monitoring
Track plant, inverter, and string-level generation instantly.
Performance Analytics
Analyze efficiency trends and production patterns visually.
Battery Intelligence
Monitor charge cycles and optimize storage dispatch timing.
Asset Health
Equipment scoring, degradation tracking, and reliability insights.
AI Forecasting
Weather-based generation prediction and anomaly detection.
Financial Metrics
Revenue tracking, ROI monitoring, and cost optimization.
Why Interactive Dashboards Win
- Live data refresh for real-time decisions
- Drill-down from KPIs to component-level insights
- Visual trend discovery and anomaly detection
- Automated alerts and smart thresholds
- Accessible across desktop, tablet, and control rooms
Performance at a Glance
0
Plants Monitored
0
GW Capacity Tracked
0
Uptime Efficiency %
0
Real-time Alerts
Key Metrics That Matter
Performance Ratio
Compares actual vs theoretical output to expose system losses.
Capacity Utilization
Measures how effectively installed capacity is used over time.
Specific Yield
Energy generated per kW installed for cross-site benchmarking.
Availability
Tracks downtime, outages, and SLA performance.
The Future is Data-Driven Renewable Operations
As solar infrastructure scales, operational excellence will depend on intelligent monitoring, predictive systems, and visual decision platforms.
Interactive dashboards are evolving into mission-critical control centers that unify engineering precision, financial strategy, and sustainability goals.
Experience Next-Gen Solar Intelligence
Explore real-time performance analytics and interactive monitoring.
Launch Live Dashboard →Live Solar Plant Network
Monitor geographically distributed solar assets in real time.
Why Solar Intelligence Platforms Matter Today
Global solar capacity is expanding at an unprecedented pace, pushing operators to manage larger asset portfolios with tighter efficiency targets. Manual monitoring and fragmented reporting systems can no longer keep up with the operational complexity of utility-scale renewable infrastructure.
Modern solar intelligence platforms unify operational data, engineering diagnostics, and financial performance into a single decision layer. This convergence enables faster response cycles, measurable efficiency gains, and scalable portfolio governance.
- Rising grid compliance and reporting requirements
- Need for real-time operational visibility
- Pressure to maximize asset ROI
- Shift toward predictive maintenance models
How Data Flows Through a Solar Monitoring System
A solar analytics dashboard is powered by a multi-stage data pipeline designed for accuracy and low latency.
1. Data Acquisition
Field devices including inverters, smart meters, and weather stations continuously transmit telemetry through industrial protocols.
2. Secure Transmission
Data travels through encrypted gateways and message brokers ensuring integrity and cybersecurity compliance.
3. Stream Processing
Real-time engines clean, normalize, and aggregate signals for instant analytics and alert generation.
4. Visualization Layer
Processed datasets feed interactive dashboards where users explore KPIs, trends, and operational insights.
Business Impact & Return on Investment
Solar dashboards convert engineering performance into financial intelligence, helping decision-makers align operations with profitability.
Revenue Optimization
Identify peak production windows and tariff advantages to maximize energy sales revenue.
Cost Reduction
Predictive maintenance reduces emergency repairs, downtime losses, and service overheads.
Asset Longevity
Condition monitoring extends equipment lifespan and improves lifecycle capital planning.
Investor Transparency
Real-time performance reporting builds stakeholder trust and portfolio credibility.
Interactive Dashboards vs Traditional Reports
Static Reports
- Manual preparation
- Outdated quickly
- Limited exploration
- Spreadsheet heavy
- Slow decision cycles
Interactive Dashboards
- Live auto-refresh data
- Real-time KPI visibility
- Drill-down exploration
- Visual analytics
- Faster executive decisions
Real-World Operational Scenarios
Grid Instability Event
Operators detect voltage fluctuation instantly, isolate affected feeders, and prevent generation loss.
Inverter Underperformance
String-level diagnostics identify degradation early, enabling rapid field inspection.
Extreme Weather Forecast
Predictive models estimate output drops and optimize storage dispatch planning.
Executive Portfolio Review
Leadership reviews multi-site KPIs and financial metrics in a unified visual command center.
Frequently Asked Questions
A solar dashboard visualizes real-time plant performance, generation metrics, equipment health, and financial KPIs.
Yes, enterprise dashboards consolidate multi-site portfolios into a unified analytics view.
Advanced systems trigger instant alerts for outages, inefficiencies, and grid anomalies.
Get the Full Dashboard Demo
See how real-time solar intelligence improves performance.
Built for Enterprise-Scale Renewable Operations
Multi-Site Portfolio Control
Monitor hundreds of assets across regions in one unified platform.
Bank-Grade Security
Encrypted data pipelines and role-based access control.
SCADA & IoT Integration
Seamless integration with industrial protocols and field devices.
Executive Intelligence Layer
Financial KPIs, ESG metrics, and investor-grade reporting.
Comments
Post a Comment